Global sentiment analysis of my most recent tweets
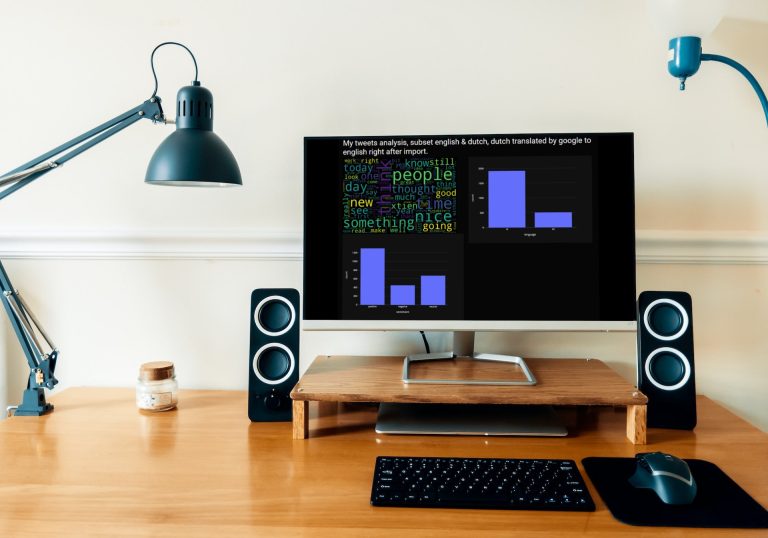
Last Monday, I read a post on LinkedIn that said participating in data challenges is not the way to build your portfolio. I don’t quite agree with that. My father used to hurl “üben, üben, üben” (German, it means exercise a lot, by the way I am Dutch) at my head and every challenge is an exercise, if only in patience. I decided to answer the question “suppose a machine investigates whether I am a bit positive on Twitter, what would the result be“. I went for a Sentiment Analysis.


