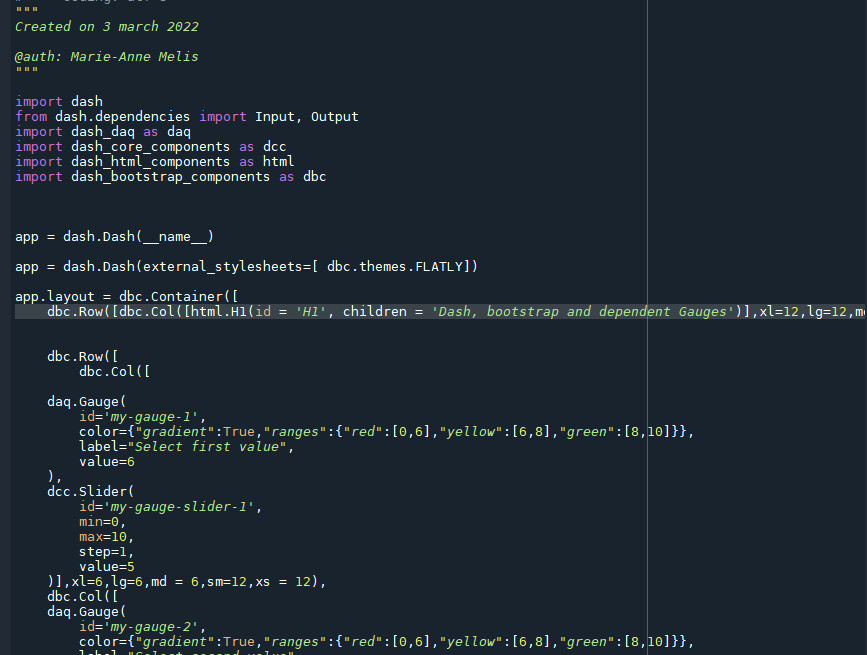
As an exercise for Dash, Python and callback functions I decided to create 2 Gauges with a Slider to select a value and an output Gauge which should show the average of the selected values. To pimp it up a little I’ve used Bootstrap.
My setup
Two weeks ago I got my Microsoft Azure Data Engineering certificate and although creating notebooks for a large amount of data in Databricks or Synapse is fun, if you want to maintain or upgrade your skills, it is very expensive. To do this exercise I used Spyder, you can download it for free. As you can see in the short video, the output of a python notebook is displayed on a local server. The short video was made in Windows 10, using the [Windows]-g combination, I think it’s meant for gaming. You get a video interface, can choose some basic settings and start recording.
The result
The result can be seen in this short video. You can find the python code on Github, the average function was not a learning goal :-).