An app that shows changes in life expectancy from multiple perspectives, with a focus on countries.
dash

NBA Clutch Shot performance for dummies
Een one-page app die het concept Clutch Shot Performance in de NBA verduidelijkt.

Figure Friday 2025-w44
Billboard Hot 100

Figure Friday 2025-w40
Math Test Results – New York City, Grades 3 to 8

Figure Friday 2025-w38
Year-End Top 3 – ATP Men’s Tennis Rankings

Figure Friday 2025-w37
Fictional Sales dataset with unusual transactions

Figure Friday 2025-w34
Montreal Metro Incidents 2019 (jan 1) -2025 (may 1)

Plotly Studio Experiment 4: replicating originals
Blogs in this series are based on the early access preview version of Plotly Studio. Plotly Studio is an AI-powered desktop application by Plotly designed to automate the creation of professional data apps and visualizations.

Plotly Studio Experiment 3: Coloring Area Charts with AC vs PY Revenue per Employee
Blogs in this series are based on the early access preview version of Plotly Studio. Plotly Studio is an AI-powered desktop application by Plotly designed to automate the creation of professional data apps and visualizations.

Plotly Studio experiment 2
Blogs in this series are based on the early access preview version of Plotly Studio. Plotly Studio is an AI-powered desktop application by Plotly designed to automate the creation of professional data apps and visualizations.

Plotly Studio experiment 1
Blogs in this series are based on the early access preview version of Plotly Studio. Plotly Studio is an AI-powered desktop application by Plotly designed to automate the creation of professional data apps and visualizations.

Maven Bookshelf challenge
An app based on Goodreads data, books and reviews, designed to help users search for titles and discover new reads.

Figure Friday 2025-w28
Corruption Perception Index (CPI): compare regions and countries

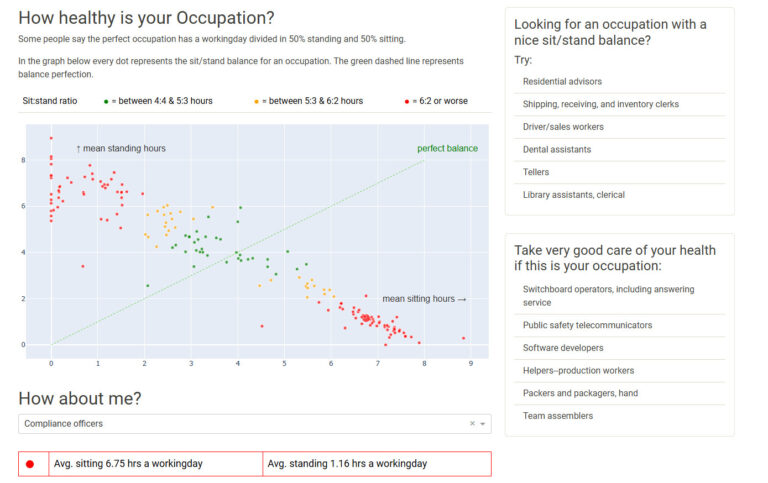
Figure Friday 2025-w23
How many bad habits do people maintain?

Figure Friday 2025-w22
Marvel films, compare worldwide gross revenue against budget, an AI Claude-experiment.

Figure Friday 2025-w21
CO2 emission figures per country, per period, limited to a few regions in Europe

Figure Friday 2025-w20
Dams in the USA: Is there an action plan for dams where an accident could have major consequences?

Figure Friday 2025-w19
Insight into the process (participants and dropouts) to get a TLC driver’s license. A TLC driver’s license is a driver’s license that gives you permission for special transportation in the USA.

Figure Friday 2025-w17
Emigration and immigration movement by country, by year in the period 1990-2024. The app provides insight into country of origin or destination in terms of income classification according to the world bank.

Figure Friday 2025-w16
A visualization showing the percentage of households in a continent or country that own a particular pet.

Figure Friday 2025-w15
An app that makes it possible to compare the “range” of different electric cars based on marketing figures. You can choose a collection of Dutch or worldwide cities as a base.

Figure Friday 2025-w14
An app that makes it possible to compare the times of the winners in different rowing categories. In addition, it is also possible to compare the winners’ times per year with a heatmap with temperature, rain and/or wind conditions.
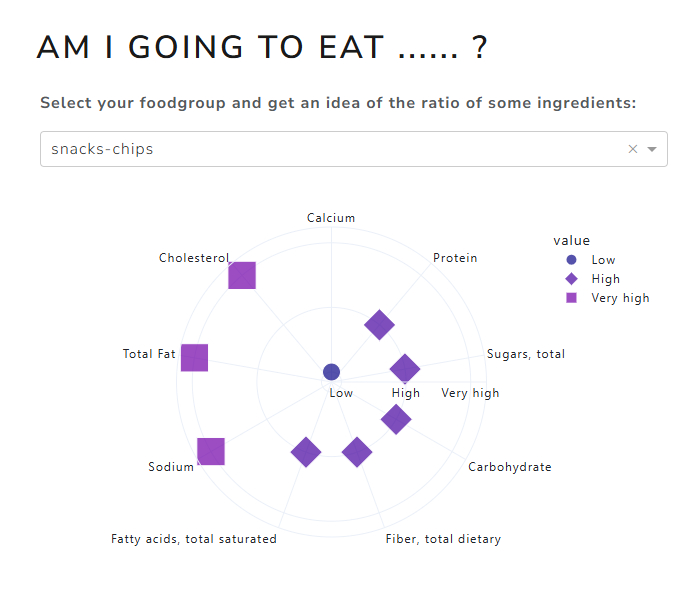
Figure Friday 2025-w13
The app gives you insight into the composition of food within a certain food group, when it comes to substances such as cholesterol, sugar and more.

IBCS experiment 3
Monthly revenue per employee overview with Year-over-Year comparison

Maven Pixar Challenge
30 Years of Pixar: A Journey of Storytelling, Innovation, and Insight.
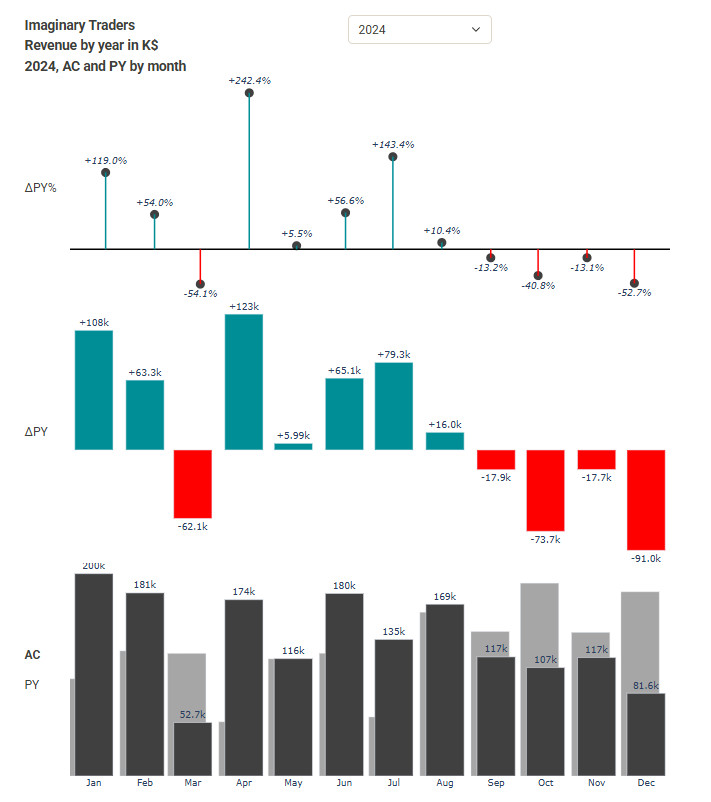
IBCS experiment 2
Annual revenue, compared with last year in $ and %


IBCS experiment 1
Current revenue and previous month’s revenue in $ and % on a single screen.