Mijn eerste AI gegenereerde afbeeldingen

Een paar weken geleden kreeg ik de kans om de plugin Imajinn AI te testen. De plugin is een product van Infinite Uploads. De plugin geeft je de mogelijkheid om in een bericht of pagina een Gutenberg Image AI Block te plaatsen dat op basis van een omschrijving die je geeft 1 of meerdere afbeeldingen …

Lees verder

my_tweets_sentiment_analysis

Global sentiment analysis of my most recent tweets

Last Monday, I read a post on LinkedIn that said participating in data challenges is not the way to build your portfolio. I don’t quite agree with that. My father used to hurl “üben, üben, üben” (German, it means exercise a lot, by the way I am Dutch) at my head and every challenge is an exercise, if only in patience. I decided to answer the question “suppose a machine investigates whether I am a bit positive on Twitter, what would the result be“. I went for a Sentiment Analysis.

Lees verder

Try before you error

Try before you error

Problem to solve: importing many files into Power BI where some are not complete and trigger an ODBC error.

While importing thousands of JSON files I bumped into the situation where some of the files weren’t following the structure and thus caused an error and the import process to stop. The files were supposed to have some general and customer information about an order and order lines structured under “lines”.

Lees verder

Getting to know my computer

Problem to solve: fast find occurences of a string in thousands of files on a Windows computer

The first computer I ever worked with was the Mac SE, small, heavy, loud, with a nice graphical user interface. When I decided to follow a computer class, the first screen I saw was black with a nice c:\>. I thought the computer was broken. Windows 3.1 was yet to come. I never paid much attention to all the possibilities Windows offers nowadays until a few days ago.

Lees verder

exercise2-dash-plotly-python-pandas

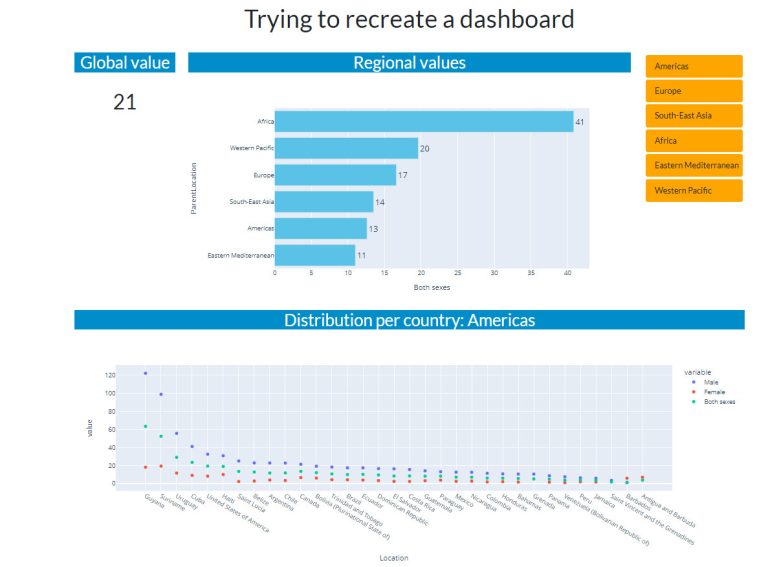
Recreate dashboard with plotly and dash

To get more experience with python I decided to recreate a dashboard I saw online, don’t bother about the subject: https://www/edwp.who.int/data/gho/data/themes/mental-health/suicide-rates. You can filter and select the data to download, I used the most recent data (2019). On the Visualisations tab (using the WHO link above) you can find the dashboard I tried to make (the second visualisation).

Lees verder

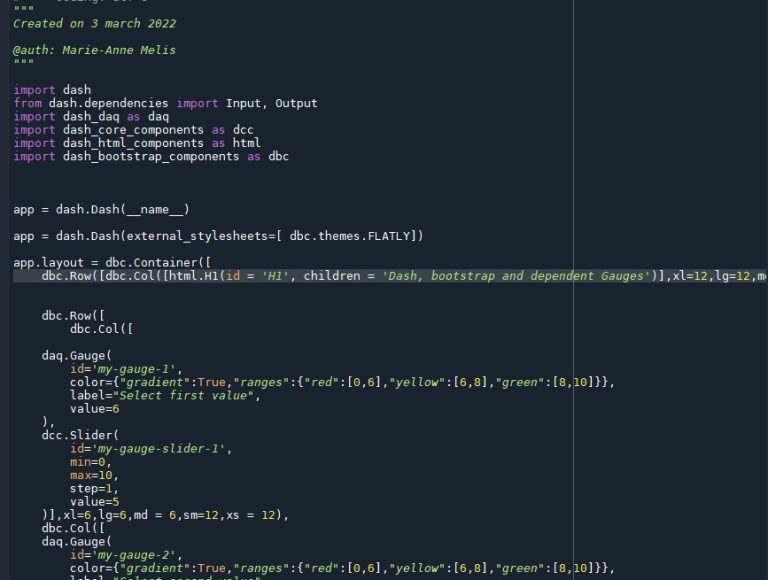
Dash, python and talking gauges

create dependent gauges in dash

As an exercise for Dash, Python and callback functions I decided to create 2 Gauges with a Slider to select a value and an output Gauge which should show the average of the selected values. To pimp it up a little I’ve used Bootstrap.

Lees verder