My Submission for the Maven Sales Challenge
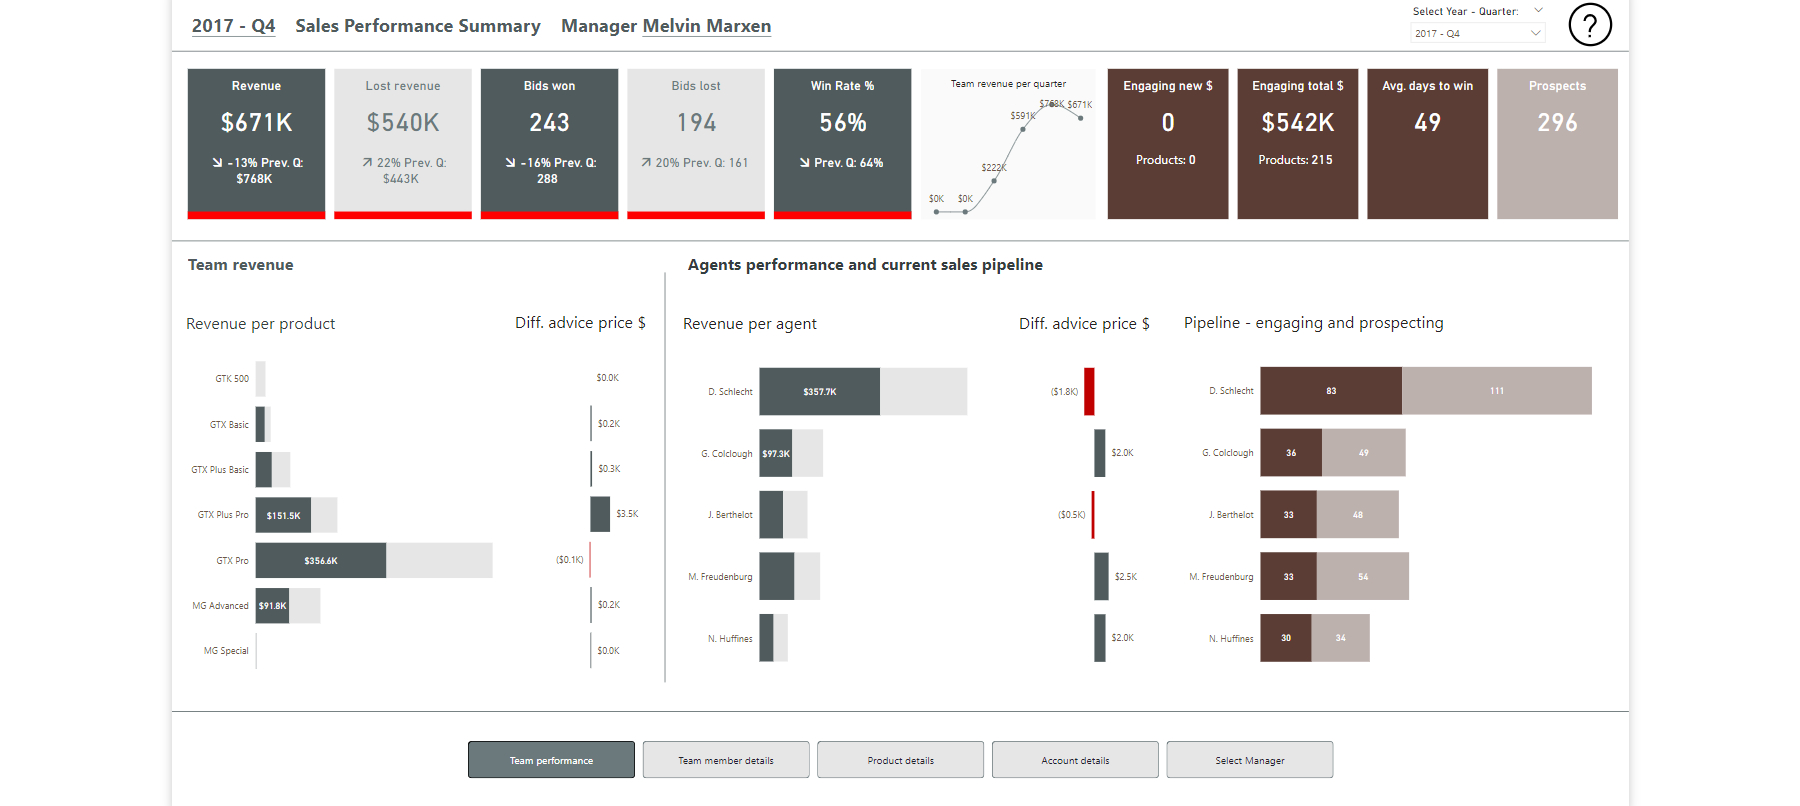
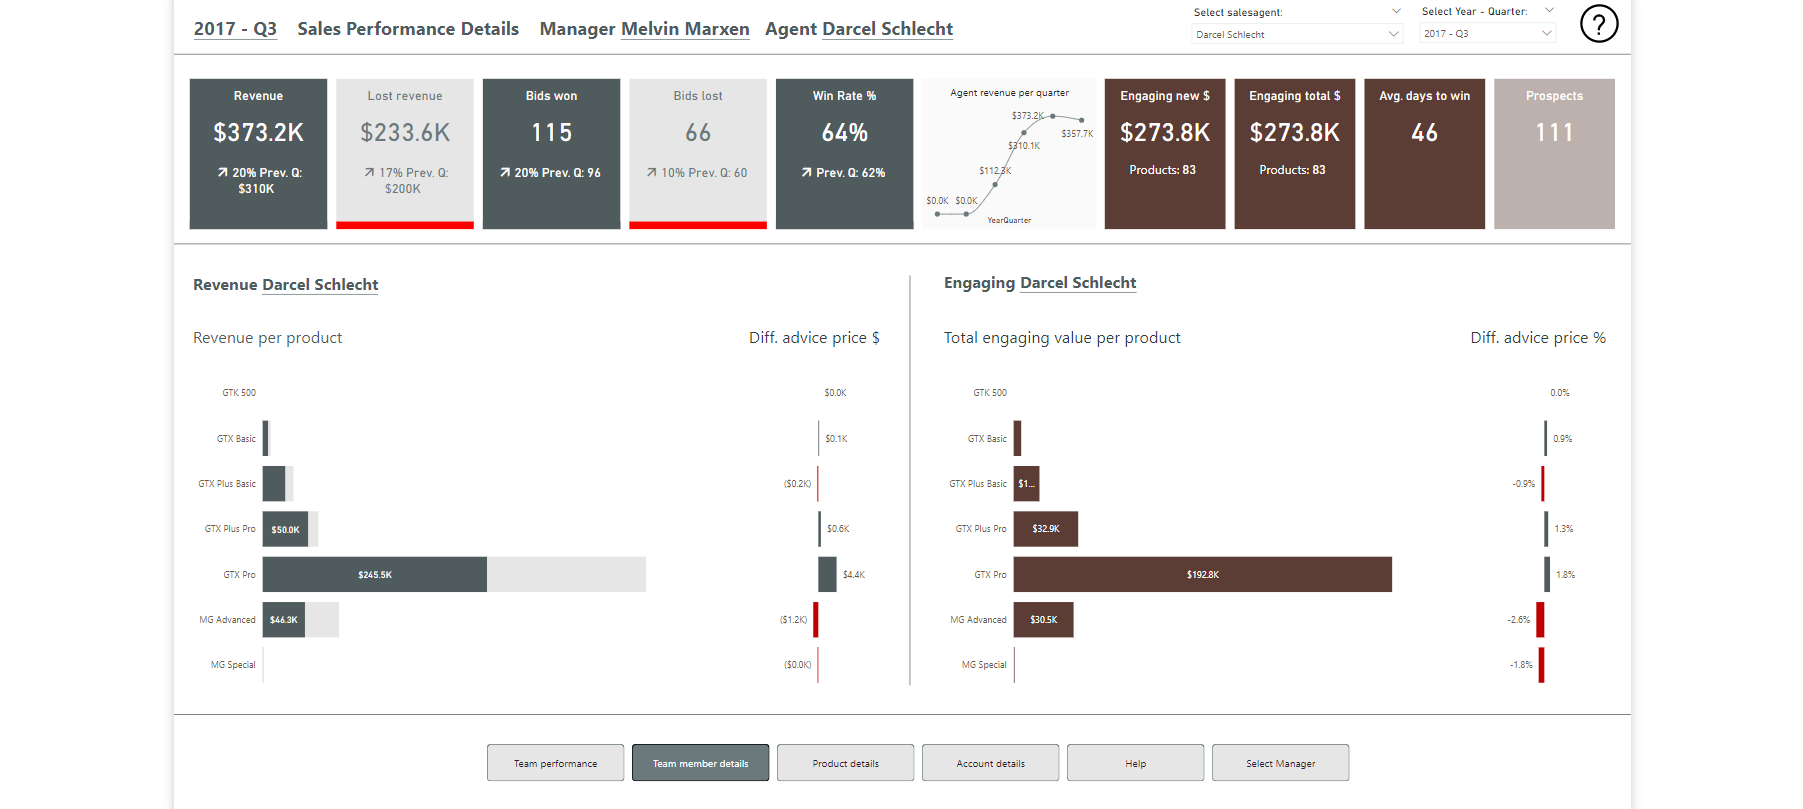
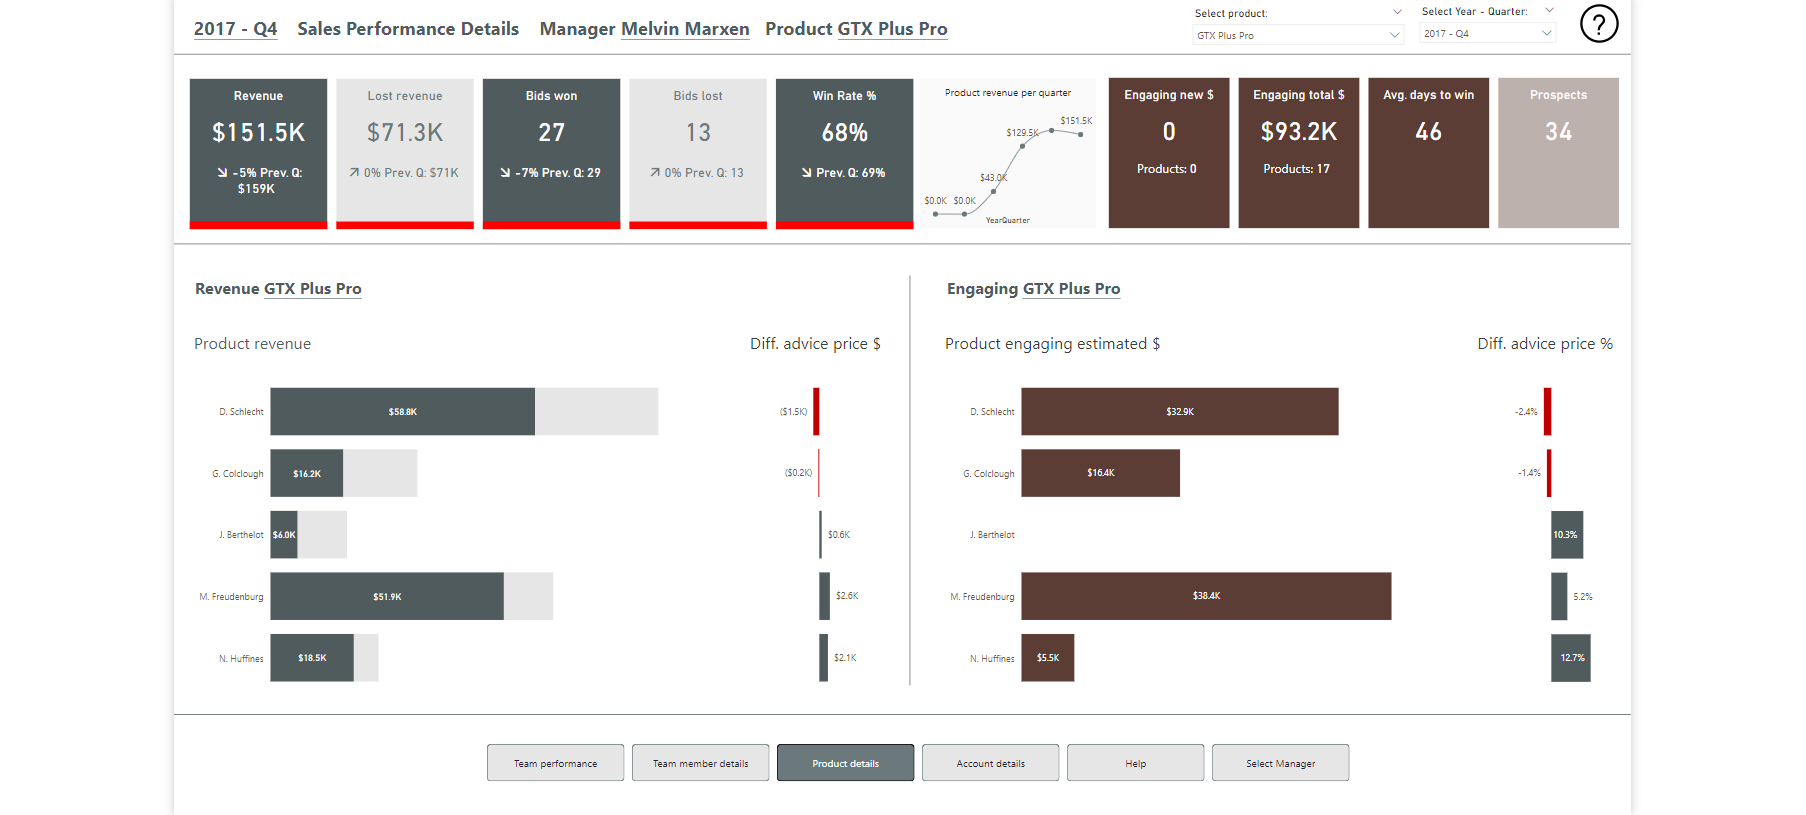
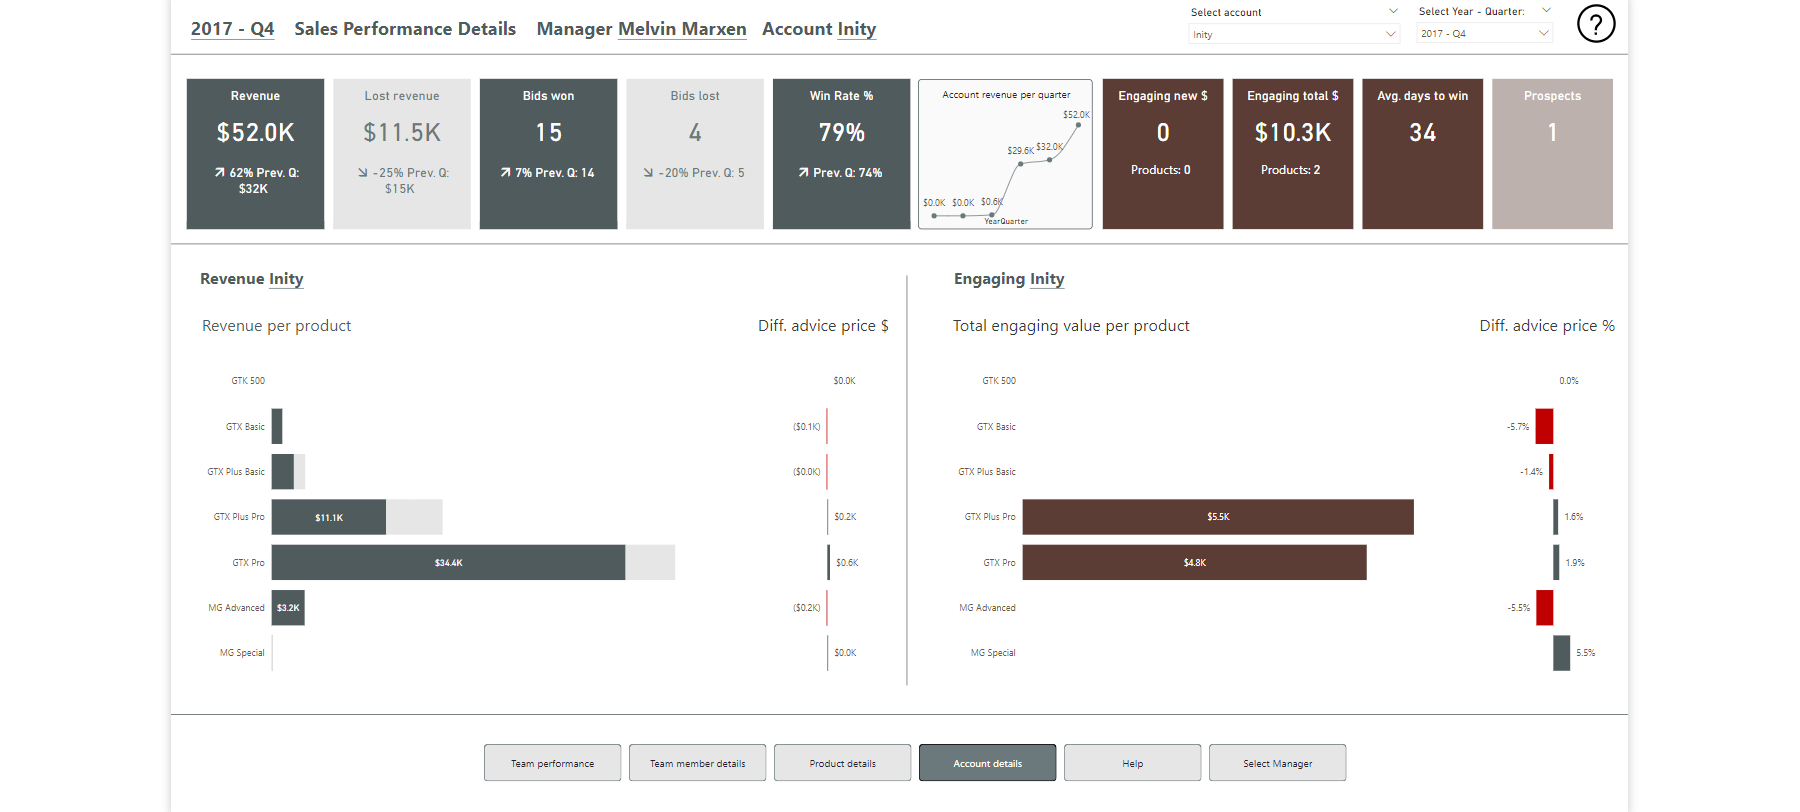
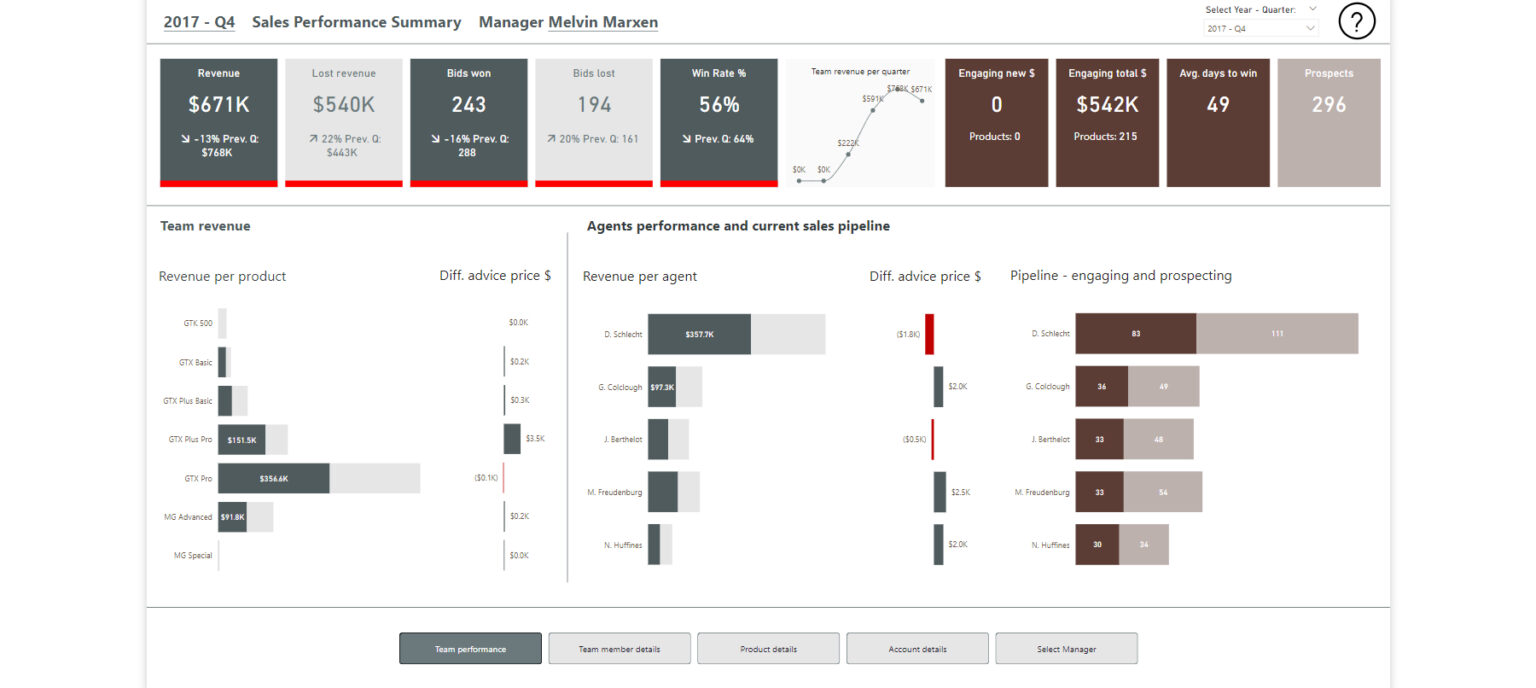
The task was to create an interactive dashboard for sales managers to monitor their team’s performance on a quarterly basis. The provided (fictional) data came from a CRM system.
Not structure the dashboard to show bad and good performers, or name teammembers as such, was deliberate, since no background information on the teams was available. If you give your best salesperson the most difficult customers it is expected that this person will probably perform worse on sales.
A detailed explanation of my approach can be found in my Maven Portfolio.
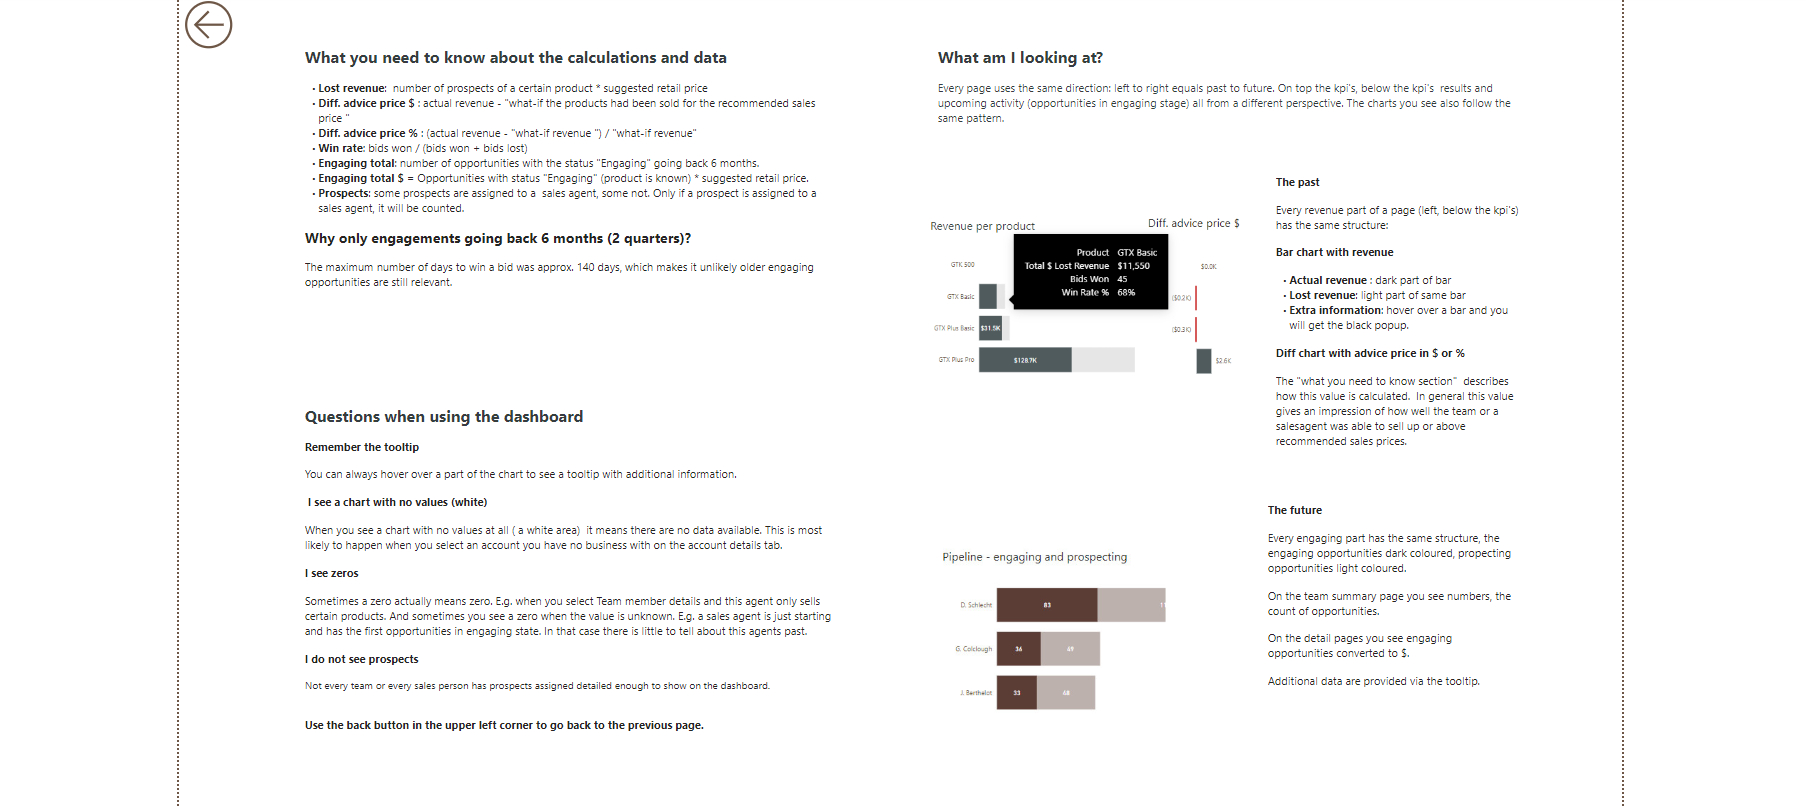
Dashboard Structure:
- Top section: Key Performance Indicators (KPIs)
(Note: The KPIs in this dashboard are based on comparisons with the previous quarter’s results, pipeline data, and missed opportunities translated into lost revenue.) - Bottom section (left to right): Past → Future